02CartoLab cartography showcase
QGIS Plugin · Publication Cartography

Maps journals & studios
actually ask for

Bivariate choropleths, cartograms, ridge maps, dot-density, 2.5D buildings, Value-by-Alpha, and automated print layouts — as native QGIS styling, not fragile pasted QML. No pip dependencies.

14
Processing Algorithms
5
Layout Templates
5
CVD Modes
0
pip dependencies
✔ QGIS 3.28+ ✔ QGIS 4.x ✔ Bivariate Maps ✔ Print Layout Automation ✔ CVD Accessibility ✔ GPL-3.0 👤 Yusuf Eminoğlu
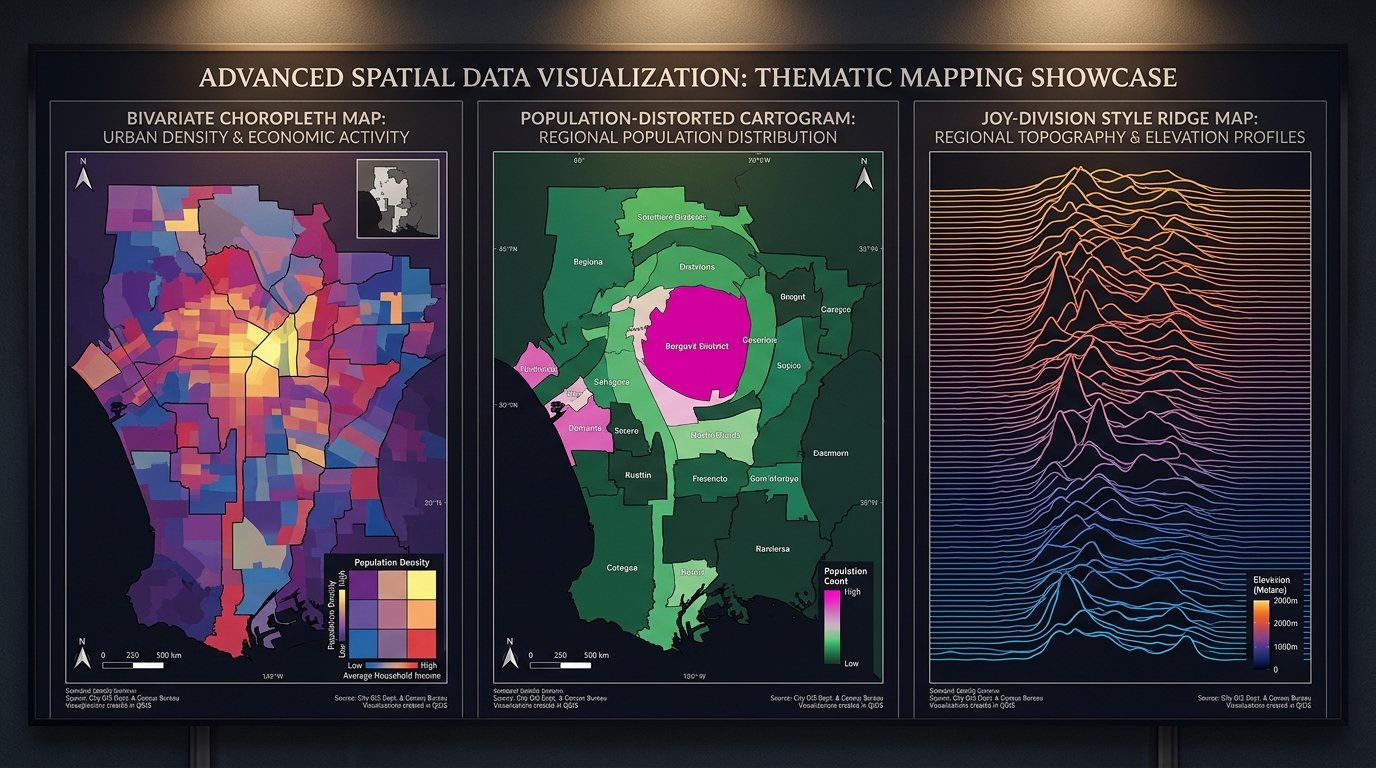
Bivariate choropleth, cartogram and ridge map showcase
Three flagship map types side by side: bivariate choropleth (income × density), population cartogram, and joy-division ridge map from a single QGIS project
About

Publication-grade cartography
without leaving QGIS.

02CartoLab is a unified thematic mapping and print layout automation studio for QGIS. It bridges map symbology and publication print layouts in one cohesive workflow: builds publication-ready choropleths (including bivariate and Value-by-Alpha), continuous-area cartograms, ridge-line relief maps, dot-density, proportional-symbol maps, and hexbin aggregation — then assembles complete print layouts in one click.

Built for planners, urban researchers, studios and academic cartography workflows. Includes a CVD accessibility inspector, Layout Designer studio dock, and 14 headless Processing algorithms. No external dependencies — pure QGIS.

👤 Yusuf Eminoğlu ✉ yusuf.eminoglu@deu.edu.tr
Keywords & Tags

Search terms on the QGIS Plugin Hub:

cartography thematic map choropleth layout print layout atlas map book bivariate 2.5d buildings cartogram dot-density hexbin value-by-alpha ridge-maps legend north arrow graticule palettes accessibility cvd colorbrewer export zero2
Quick Info
Version
1.0.0
Category
Vector
License
GPL-3.0
QGIS Min
3.28
QGIS Max
4.99
pip deps
None
Features

One studio, every map type
journals actually publish

A complete cartographic toolbox — from advanced thematic styling to one-click print layout generation, all within native QGIS.

🎨

Bivariate & Value-by-Alpha

3×3 and 4×4 color matrices encoding two simultaneous variables. Value-by-Alpha fades unreliable values instead of hiding them. Diamond/square legend decorators included.

📈

Continuous-Area Cartograms

Gastner-Newman topology-preserving cartograms that distort polygon shapes proportionally to a value field. Maintains contiguous boundaries and neighbor relationships.

🏔

Ridge-Line Relief Maps

Transform any raster (DEM, heat maps, density, accessibility) into stacked Joy-Division-style ridge-line profiles. Dramatic topographic storytelling from any grid surface.

📥

One-Click Print Layouts

Auto Map Sheet builds a complete publication layout from the current view: titled frame, filtered legend, scale bar, north arrow, coordinate graticule, and credits — in one click.

👁

CVD Accessibility Inspector

5-mode Color Vision Deficiency simulation: Normal, Deuteranopia, Protanopia, Tritanopia, Achromatopsia. Real-time WCAG 2.1 AAA contrast scoring for accessible maps.

Dot-Density & Hexbin

Seeded, hole-aware dot placement inside polygons (one dot = N units). Pointy-top hexbin aggregation with count/sum/mean — overplot-free density cartography at any scale.

🏛

2.5D Building Extrusion

Native QGIS 2.5D renderer with height/floor-field extrusion, 10 material presets, shadows, directional shading, stepped floor bands, per-floor colors and QML export.

📚

5 Layout Templates

Report Figure (16:9), Academic Journal (A4 2-col), Exhibition Poster (A1/A2), Fact Sheet, and Comparative Diptych — each with calibrated margins, typography and grid.

📊

Adaptive Classification

Geometric Interval, Fisher-Jenks and Head/Tail Breaks for skewed urban data. One-step normalization: rates per capita, z-score, robust MAD-z, percentile rank, log.

Module Catalog

16 modules, one dashboard

Every module is reachable from the 02CartoLab Dashboard and the Processing Toolbox — scriptable, composable, modeler-ready.

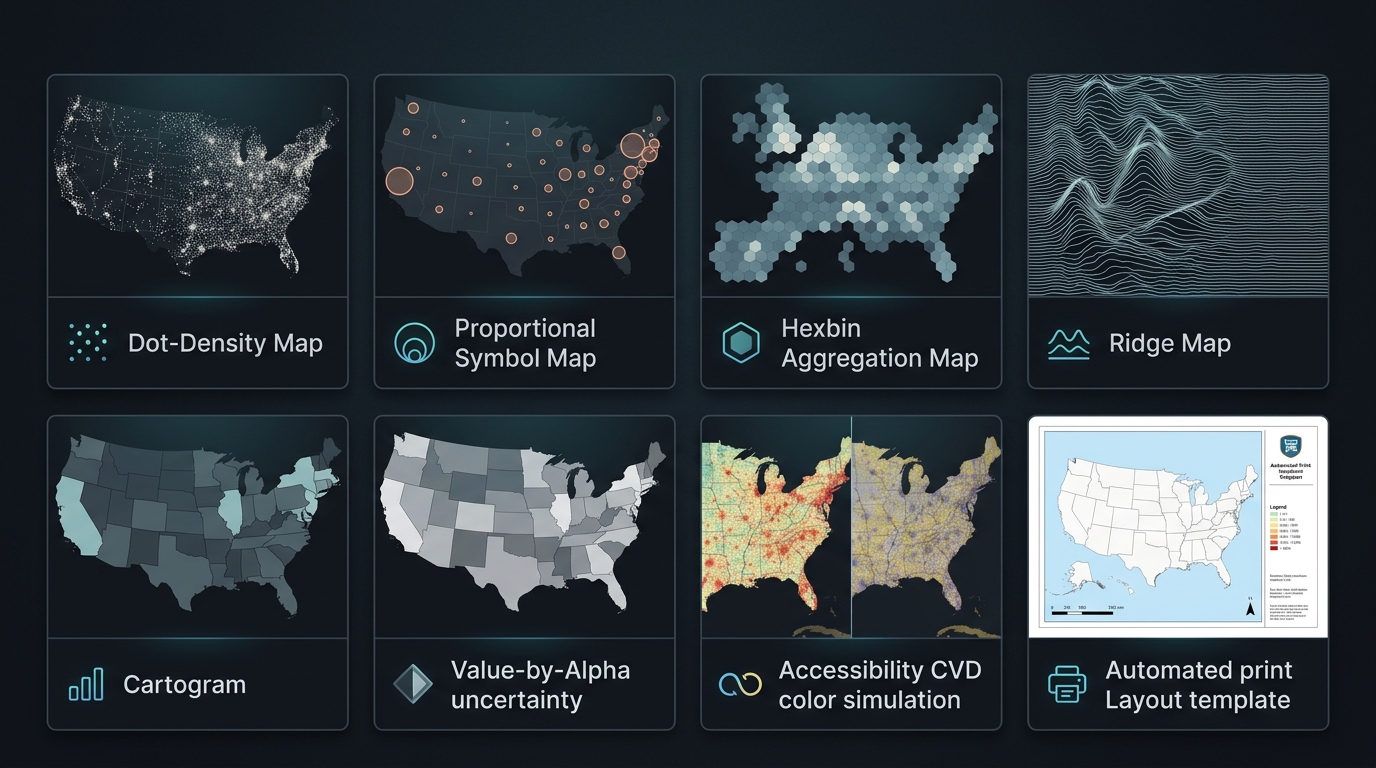
02CartoLab module showcase grid
8 of the 16 modules visualized: dot-density, proportional symbols, hexbin, ridge map, cartogram, Value-by-Alpha, CVD simulation, automated layout
Module What it does Surface
Quick StyleOne-click graduated or categorized renderer with ColorBrewer + viridis palettes and live previewDashboard Processing
Colour Palettes & CVD24+ ramps with 5-mode CVD simulation and WCAG 2.1 AAA contrast scoringDashboard
2.5D Building StylingFloor extrusion, presets, shadows, per-floor bands, QML exportDashboard Processing
Bivariate Choropleth3×3 / 4×4 color matrices, custom corners, diamond/square legendsProcessing Layout
Value-by-AlphaValue → hue, reliability → opacity — reliability-aware visualizationProcessing
CartogramContinuous-area distortion (Gastner-Newman) proportional to a value fieldProcessing
Ridge MapRaster surface → stacked joy-division ridge linesProcessing
Adaptive ClassificationGeometric Interval, Fisher-Jenks, Head/Tail BreaksProcessing
Dot-Density MapSeeded, hole-aware dots inside polygons — one dot per N unitsProcessing
Proportional SymbolsFlannery-compensated graduated point symbols with nested-legend valuesProcessing
Hexbin AggregationPointy-top hex grid — count / sum / mean, overplot-freeProcessing
Visual-Center LabelsPole-of-inaccessibility (polylabel) anchors always inside the polygonProcessing
Graticule / Reference GridMeridians & parallels on nice intervals with coordinate labelsProcessing
Normalization & RatesRate, z-score, robust z, min-max, percentile rank, log — prep before classifyingProcessing
Layout Template Gallery5 publication archetypes: Report Figure, Academic Journal, Exhibition Poster, Fact Sheet, DiptychLayout Studio
Auto Map SheetComplete print layout from current view — map, legend, scalebar, north arrow, grid, creditsLayout Studio
Bivariate Choropleth

Two variables,
one honest map

Encode income & density, vulnerability & exposure, or any two urban indicators simultaneously — with a 3×3 color matrix legend that tells both stories at once.

3×3 and 4×4 color matrices
Custom corner colors for full palette control
Diamond and square legend formats
Value-by-Alpha: reliability drives opacity
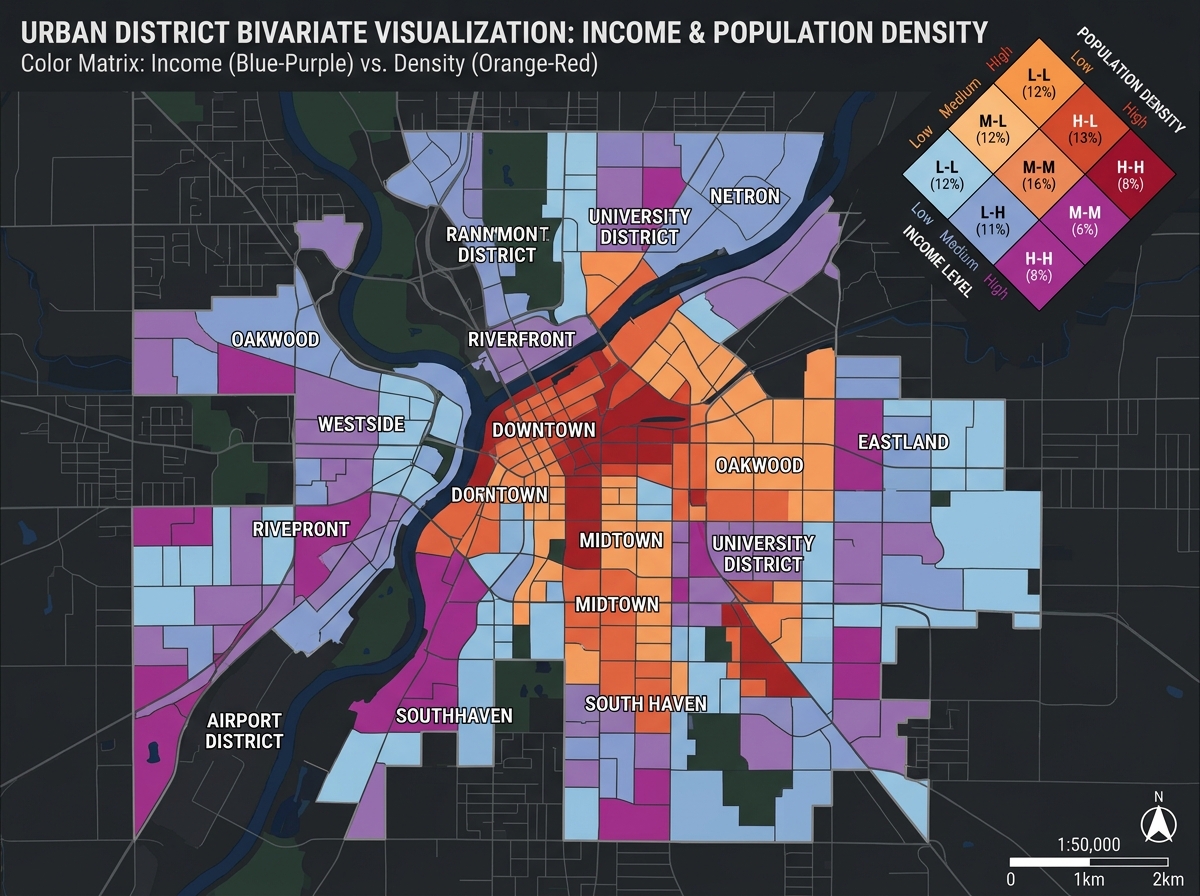
Bivariate choropleth map with 3x3 color matrix legend
Urban district bivariate map: income (blue-purple axis) × population density (orange-red axis) — with diamond 3×3 legend
Print Layout Automation

From map view to
publication in one click

Auto Map Sheet builds a finished layout from the current QGIS view. Five publication archetypes cover every output format from academic journals to exhibition posters.

01 Report Figure — 16:9 landscape
02 Academic Journal — A4 2-column
03 Exhibition Poster — A1 / A2
04 Fact Sheet — A4 portrait
05 Comparative Diptych — side-by-side
+ Layout Manager: list, open, duplicate, delete, export PNG/PDF/SVG at 96–600 dpi
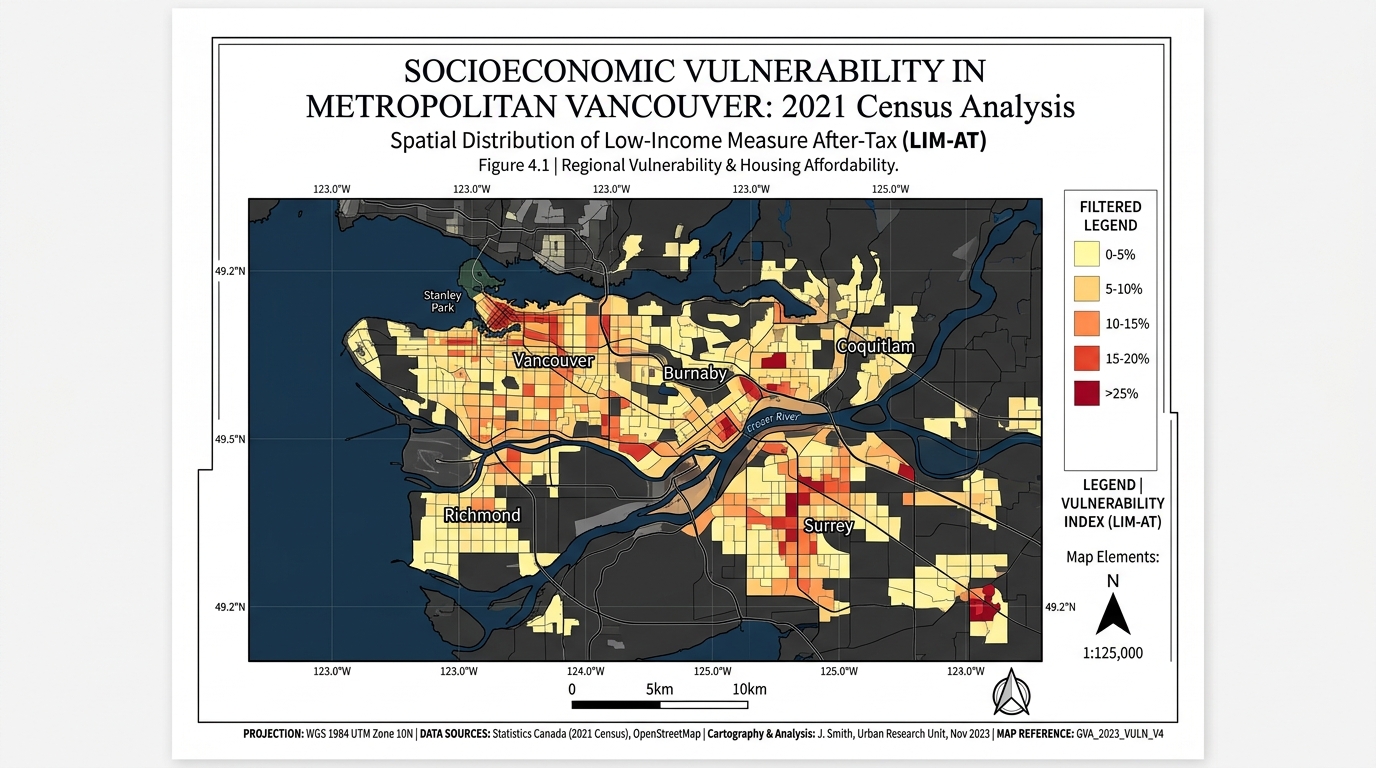
Publication-ready print layout with legend, scale bar, north arrow
Auto Map Sheet output — complete academic-style layout with filtered legend, coordinate graticule, scale bar, north arrow, and source credits
Compatibility

Tested on every runtime

Release verification runs on both QGIS LTR and the current stable release. Zero external dependencies means zero install friction.

🟢
QGIS 3.28+
Minimum requirement. Full feature support on all 3.x releases.
✔ Verified
🔵
QGIS 3.44 LTR
Primary release target. Verified before every publish.
✔ Release Runtime
QGIS 4.2
Qt6 / QGIS 4 verified. No deprecated API usage.
✔ Release Runtime
📦
Zero pip deps
Pure QGIS API + NumPy (bundled). No external installs.
✔ No Install
📋
14 Processing Algorithms
All algorithms run headlessly in Model Builder and Python scripts.
✔ Modeler-Ready
💻
Win · Linux · macOS
Platform-agnostic Python. Tested primarily on Windows (OSGeo4W).
✔ Cross-platform
Installation

Up and running
in 30 seconds

01

Plugin Manager (Recommended)

Open QGIS → Plugins → Manage and Install Plugins → Search 0202CartoLab → Install.

zero2cartolab
02

Install from ZIP

Download the latest release ZIP from GitHub → Plugins → Install from ZIP → select the file.

zero2cartolab.zip
03

Development Install

Clone the repository and set QGIS_PLUGINPATH to the parent directory. Access via Plugins → 02CartoLab Dashboard.

QGIS_PLUGINPATH=.../qgis_plugins
⇓ Open in QGIS Plugin Hub
Changelog

Release history

v1.0.0 2026-08-20 Initial Release
Publication Layout Template Gallery: 5 distinct archetypes (Report Figure, Academic Journal, Exhibition Poster, Fact Sheet, Comparative Diptych)
Thematic Symbology Studio: bivariate choropleths (3×3 and 4×4 matrices)
Value-by-Alpha uncertainty maps for reliability-aware visualization
Continuous-area cartograms (Gastner-Newman topology-preserving)
Joy-division ridge maps from any raster (DEM, heat, density)
Hole-aware dot-density and Flannery proportional-symbol maps
Hexbin aggregation: count, sum, mean — pointy-top hex grid
Architectural 2.5D building extrusion with solar angle and floor bands
Layout Designer Studio Dock with Heckbert scalebars and north needles
Multi-page Map Book Atlas engine
Palette & Accessibility Inspector: 5-mode CVD simulation
WCAG 2.1 AAA real-time contrast evaluation
14 headless Processing Algorithms — modeler and script ready
Automated coordinate graticules with labeled meridians & parallels
Visual-center label points (polylabel) always inside polygons
Zero external dependencies — pure QGIS 3.28+ and 4.x